
Between the holiday week, a 5-year old’s birthday party and a cross country due diligence trip, I’m spread a bit thin this week. Rather than shutting it down for a few days, this week will be only charts. Have one that you want featured? Email it to me and tell me why its interesting.
Chart of the Day
Today’s housing boom is MUCH more of a national phenomenon than the bubble of the mid-aughts. Some big implications here that I suspect have a lot to do with both tax policy and the ability to work remotely.
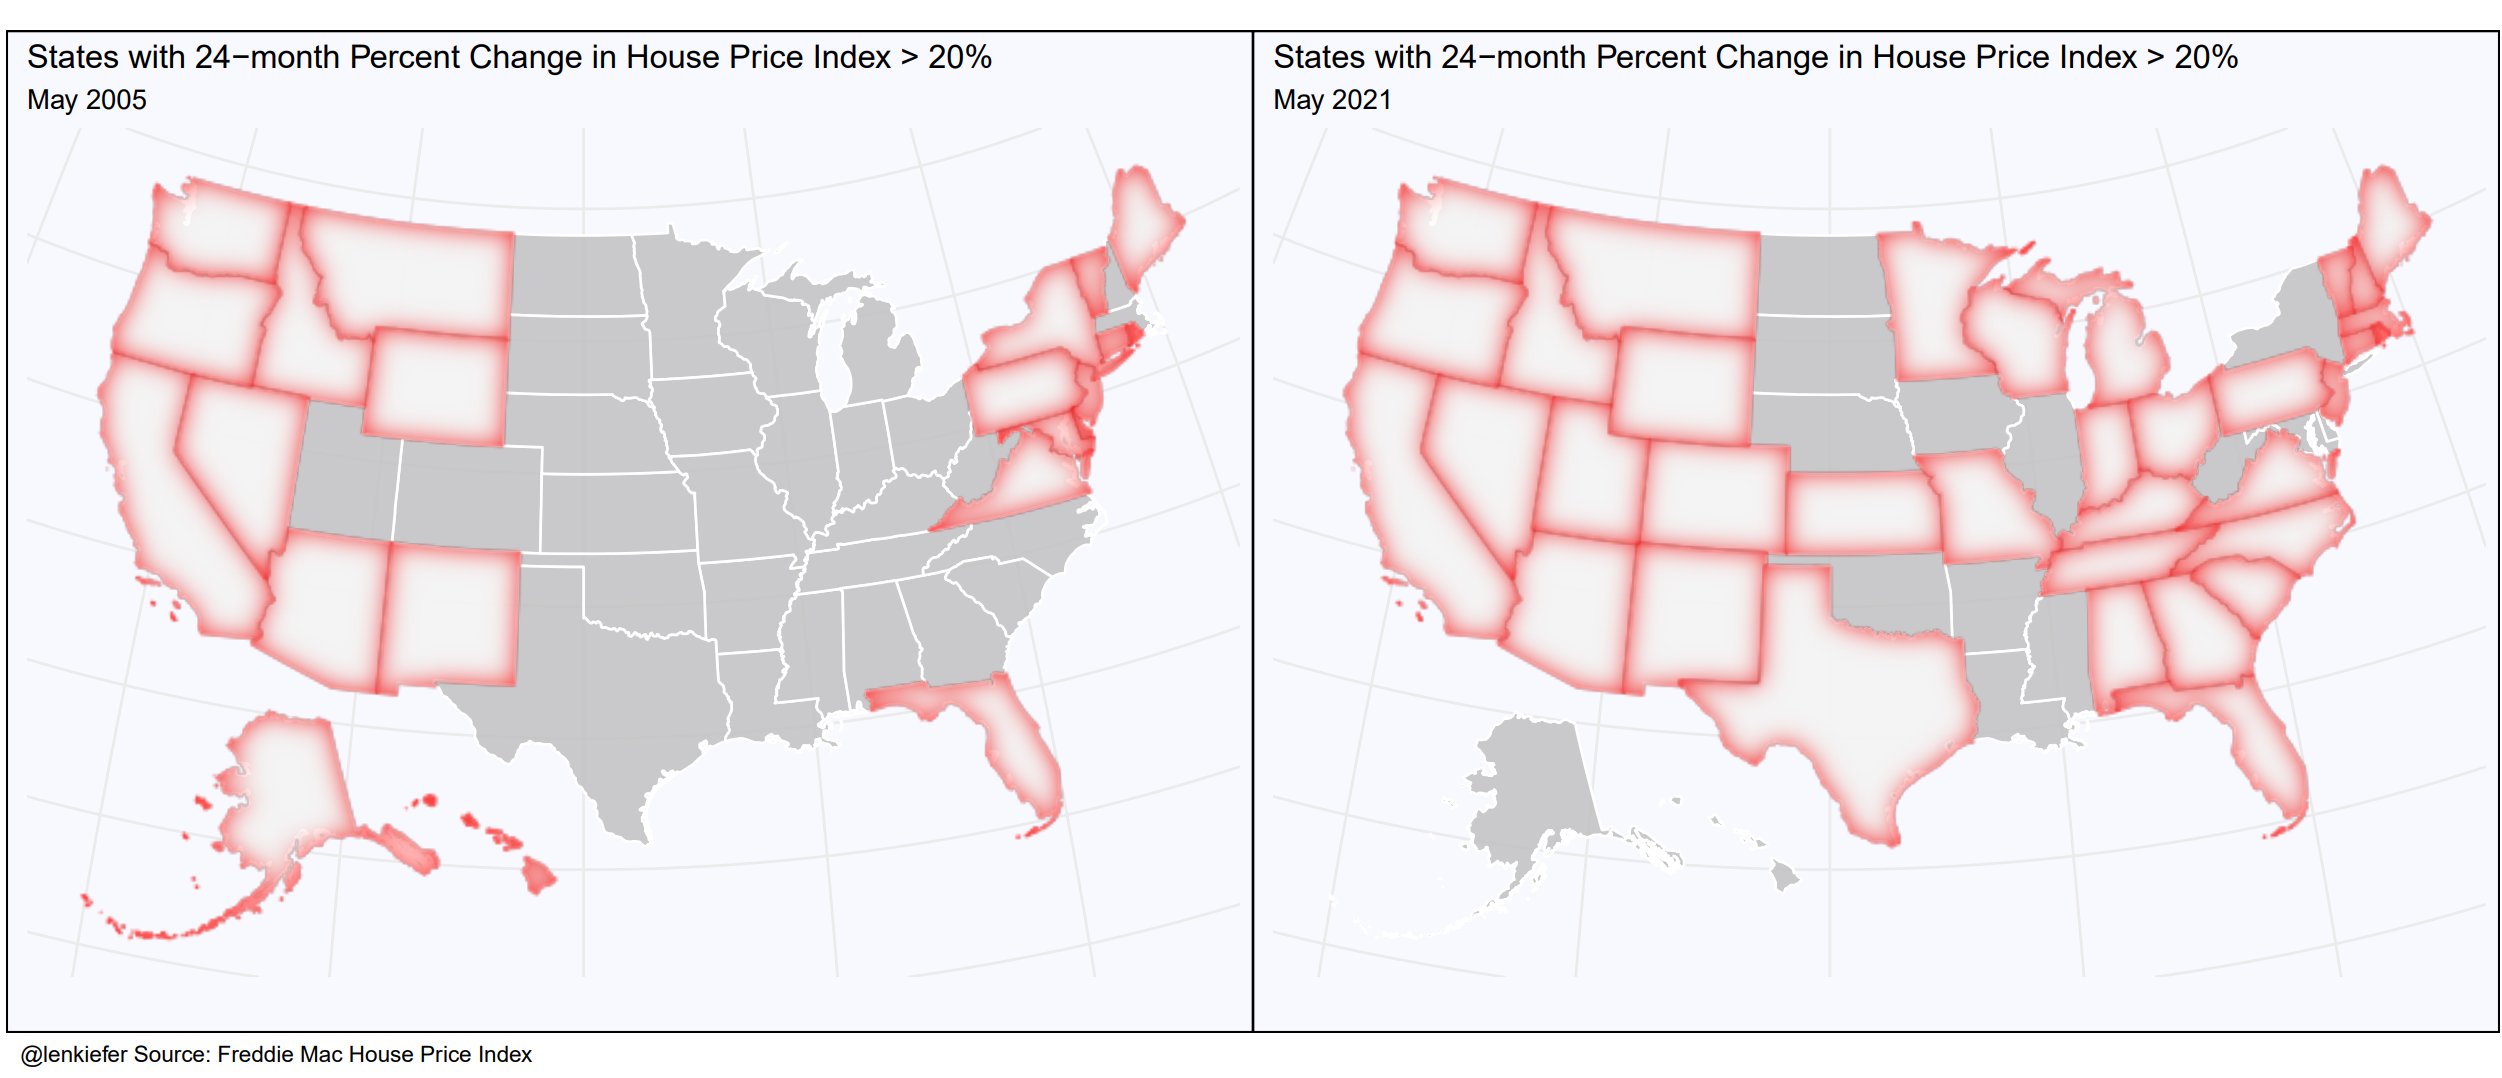
Source: Len Kiefer
Basis Points – A candid look at the economy, real estate, and other things sometimes related.
Visit us at RanchHarbor.com