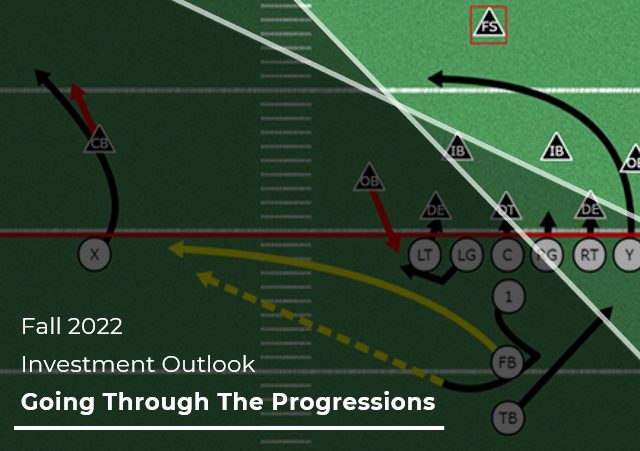
With football season in full swing, we cannot help but compare the current real estate investing environment to a quarterback ‘going through the progressions.’ In football parlance, these are the patterns that a quarterback must read when deciding which receiver to throw the ball to.
Here is a quick synopsis of how the ‘progression’ process works:
Prior to the play, the quarterback knows where he wants to throw the ball to maximize the design of the offensive play. This can be based off a matchup advantage between a certain receiver and defender or the type of defensive coverage (think zone or man-to-man). On a given pass play, the quarterback will have multiple receivers that he will consider throwing to – he will make his ‘progressions’ through each receiver as the play unfolds. If his primary option is not open the quarterback will ‘progress’ to the next receiver. This ‘progression’ continues until the quarterback finds the best option for his team’s success.
The objective is to identify what the defense is doing and adjust decision making to maximize the odds of completing a pass and gaining maximum yardage.
The process of recognizing patterns and ‘going through the progressions’ efficiently to find the open receiver is what defines a competent and successful quarterback.
As a real estate investment manager and asset owner focused on small-cap, value-add real estate opportunities in the private markets, we assume the role of quarterback for our investors as we are constantly ‘going through our progressions’ to assess new deals and manage existing investments.
In this investment outlook, we will take you through some of our progressions and provide insight into the patterns we are seeing.
Current interest rates. Stating the obvious, interest rates on both fixed-rate and floating-rate debt have increased significantly in 2022. We pay particular attention to the benchmark 5-year and 10-year US Treasury Bond and the Secured Overnight Financing Rate (SOFR). We, like most value-add investors, are evaluating short-term (i.e., 3 years), floating-rate debt options to acquire a property, implement a capex program to improve the property and attract higher rents. This floating-rate debt is priced at a spread over SOFR. Once the property is stabilized, we look to either sell or refinance the property with longer term (i.e., 5-10 years), fixed-rate debt that relies on the benchmark 5-year and 10-year US Treasury Bonds as a proxy for where we think longer term debt will be priced.
In today’s highly volatile short-term rate environment, we are pivoting away from the traditional first option and looking at lower leverage fixed-rate debt to mitigate risk to our investors. Said another way, we are reading the progressions, seeing that the primary receiver is covered, and looking to the second and third receivers to maximize our potential of success.
To further inform our view, we focus on interest rate forward curves. These curves represent the market’s current expectations for future interest rates. The chart below is from Chatham Financial and provides market expectations for SOFR and the 5-year and 10-year US Treasury bonds over the next 10 years. These forward curves change as current interest rates change.

Source: Chatham Financial
How do we view the current interest rate environment? We believe rates will be higher for longer, putting downward pressure on asset values. How much higher rates will go is the more challenging question and makes it difficult to value new opportunities.
Progression: We are taking a very conservative view on leverage and the term of any debt we are assuming or originating. In this environment, we believe it is best to apply a low-leverage approach (i.e., 50% – 60% LTC) with sufficient term to avoid having to time the market and be caught in a forced-sale position. As a result, we are establishing valuations that are ranging between 10% – 30% below seller’s asking price.
Rent growth and vacancy rates. Over the past few years, rent growth and vacancy rates have been positive across the multifamily and industrial sectors. NCREIF’s US industrial vacancy rate as of Q2 2022 was 1.7%, well below the historic average of 7.8%. Similarly, the US multifamily vacancy rate was 5.6% in Q2 2022 compared to the long-term average of 7.6%. Vacancy rates are at or near historic lows.
With respect to the multifamily sector, we believe rental demand will remain strong given the impact of higher interest rates on home ownership as the cost to own vs the cost to rent is widening and will continue to persist. That said, we recognize rent or lease rates do not grow infinitely and because of the historic rent growth we recently experienced we are seeing rental growth soften and expect it to revert to historic norms. Historically, the market has experienced inflection points emerge where Y-o-Y rents decline and vacancy rates move upward. The chart below provides a historical perspective of the relationship between rent growth and vacancy rates.

Source: Federal Reserve Economic Data
Progression: There is no question that managing rental rates and vacancy levels is critical for all asset owners to continue to drive NOI growth. It is more art than science when it comes to increasing, holding, or decreasing rents in relation to vacancy levels. We continue to evaluate new acquisitions with conservative (if any) rent growth and vacancy rates. We do not rely on assumptions that are outside of our control, rather we use them as a way to outperform our return assumptions.
Cap Rates. Determining what current and exit cap rates should be is THE challenge for all real estate investors. There is no debate about cap rates increasing, it is a matter of how much cap rates will expand over both the near term and long term. For a national perspective on cap rates, we provide the information below from GreenStreet’s most recent ‘Cap Rate Observer’ publication.

Clearly, cap rates are increasing across all asset classes. These are significant moves upward in a short amount of time. The obvious driver to cap rate expansion is the cost of capital (i.e., interest rates) and negative leverage is now a very current topic for investors and asset owners. Herein lies the dilemma. Do you buy deals with negative leverage assuming you can grow your way out? While most buyers in today’s market are making this bet, in a higher interest rate environment with the odds of a recession high, we are not willing to underwrite deals that require historically high rent growth to cure the issue of negative leverage.
The natural corollary to cap rate expansion is a decline in property prices. Below is Green Street’s view on property price declines nationally over the past 3 months.

Progression: In the near term, determining appropriate exit cap rates to apply to new investments will remain challenging. To gain a better understanding of the market, we are constantly underwriting and evaluating new opportunities and tracking where deals are getting done providing us with real time feedback and the ability to identify the best opportunities.
Summary of Progressions: We are underwriting with lower leverage assumptions, carefully evaluating rental growth rates, choosing to be conservative with exit cap assumptions, and being patient identifying new investments. We are focused on opportunities with a conservative capital stack and fixed-rate debt with sufficient term to weather any short-term market swings and allow us to invest in submarkets with strong long-term fundamentals. There are opportunities out there and we believe plenty more will emerge over the coming quarters.
RanchHarbor Q3 Recap and Outlook
RanchHarbor had positive investment activity in Q3. We successfully closed the sale of The Berkley, a 72-unit apartment complex in Austin, TX generating a strong return for investors and completed a refinance of The Coronado, a 44-unit apartment complex in Phoenix, AZ, generating a return of all investor capital, preferred return, and some profit.
In Q3, we reviewed over thirty deals representing approximately $250 million in total equity investment and an average equity investment of $8.3 million. In most cases, we were not comfortable with pricing due to the short-term structure and higher leverage of the debt or assumed rent growth projections needed to achieve reasonable returns. The risk far outweighs the reward. For now, we are seeing that the spread between seller and buyer value expectations is still not in-sync with the realities of the current market environment. However, the bid-ask spread is improving as we have observed a number of deals transact with notable price reductions.
Having said that, we recently went into escrow on a value-add, multifamily property in Austin, TX with a projected closing in Q1 2023. This opportunity is a ‘special situation’ and indicative of how we can get comfortable doing a deal in the current environment. We walked away from this same opportunity back in June due to seller / buyer disconnect on valuation but continued to believe in the long-term potential of the asset and location. We remained in contact with the seller and re-engaged to acquire the asset in the last 30 days at a discounted valuation (17% below Q1 2022 offers) that satisfied our current underwriting requirements. Of particular note, we are assuming the seller’s fixed-rate Freddie Mac loan with over six years of term remaining at sub 50% LTC. This capital structure allows us to be patient with our business plan and benefit from the favorable long-term dynamics of the submarket. Over the next few quarters, we expect this dynamic between sellers and buyers to continue and transaction volume to increase.
In our Summer Investment Outlook titled ‘The Discovery Channel,’ we provided the following list of critical variables that we were watching closely:

As we ‘go through our progressions,’ these variables remain critical to disciplined underwriting on new opportunities and the asset management of our existing investments.
In this environment, as we progress through our primary and secondary receivers, they are simply not open. To find the open receiver (i.e., good investment opportunities), we are implementing a higher level of patience and discipline, which allows us to avoid forcing anything into coverage.
Like any successful quarterback, we intend to avoid interceptions and sacks and find the open receivers!
Sincerely,
The RanchHarbor Investment Team
ABOUT RANCHHARBOR
RanchHarbor is an integrated real estate investment firm based in Newport Beach, Calif., focused on investing in sub-institutional value-add opportunities. RanchHarbor offers joint venture equity and general partner co-invest equity, targeting commercial and multifamily real estate investments between $2 million and $10 million in select U.S. markets. The firm also provides sophisticated asset management services to its institutional and private investors and operating partners. Since its founding in 2020, RanchHarbor has closed on nine investments exceeding $170 million in total AUM across six states. For more information, visit ranchharbor.com. Follow the company on LinkedIn.